- | 8:00 am
This map shows exactly where 70,000 of the world’s biggest polluters are located
With data on cargo ships, oil fields, cattle feedlots, and more, the map could help businesses, investors, and policymakers know what sites to target first in order to reduce emissions.
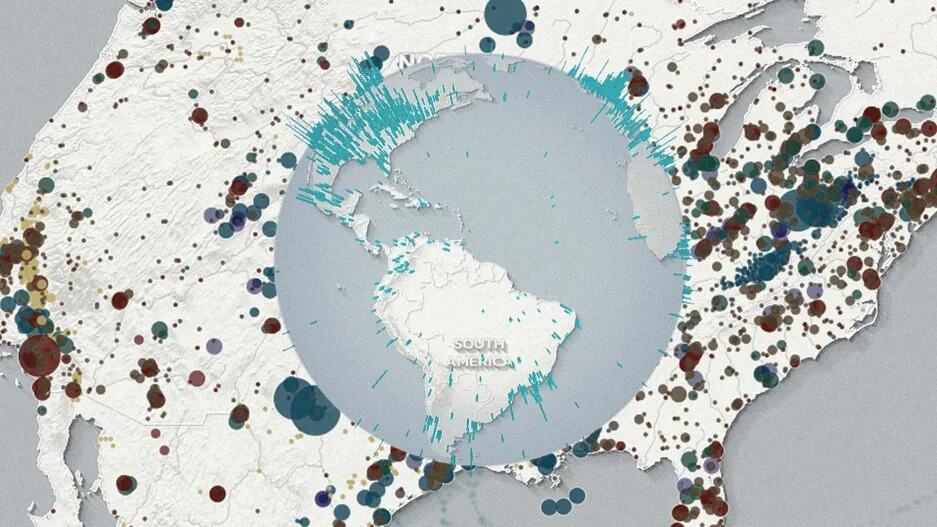
A single steel factory in Jiangsu, China, emits 43 million tons of CO2 every year—more than the entire country of Madagascar or Nicaragua. It’s one of more than 70,000 individual sources of climate pollution listed on a new map made from what is now the largest, most detailed database of greenhouse gas emissions in the world.
“You can’t manage emissions if you don’t know what they are,” says Gavin McCormick, founder and executive director of WattTime, an environmental tech nonprofit that is part of a coalition of organizations, data scientists, researchers, and artificial intelligence specialists called Climate Trace, which built the inventory and the map. The database includes everything from cargo ships to landfills—the biggest climate polluters in energy production, transportation, waste, agriculture, and heavy industry.
Countries are often slow to release emissions data, so that information can be out of date by the time it’s available, and even official emissions reports can be inaccurate. Climate Trace makes the most detailed calculations possible for each source. At cattle feedlots, for example, where there are emissions of the potent greenhouse gas methane, they use satellite data to measure the size of the facility, and then use an algorithm to identify whether it’s a dairy or beef operation and to estimate the number of cows. That gets multiplied by an estimate of emissions per cow for that location.
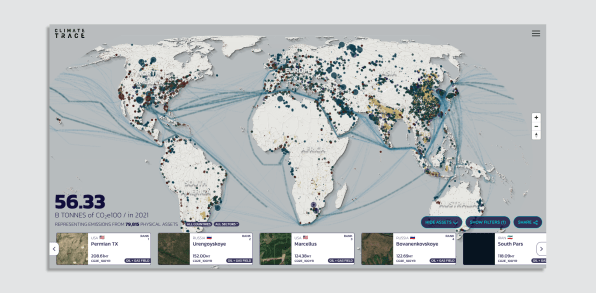
At oil and gas fields—the biggest polluters on the map—the team used detailed models based on data including oil and gas volumes, production techniques, and satellite data about gas flaring and leaks. Emissions at one facility might be 10 times higher than another of the same size because of how that site is managed.
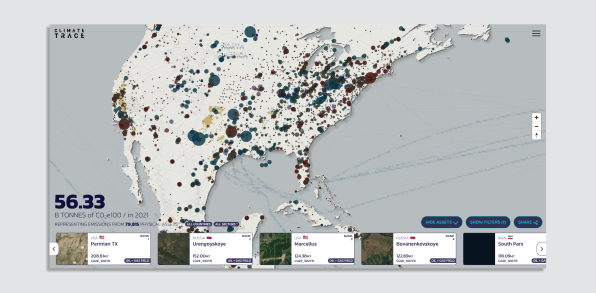
“Pinpointing those facilities that are both high intensity and high volume gives business, investors, policymakers, and consumers a clear indication of which assets to target first for emissions reduction or decommissioning,” says Deborah Gordon, a senior principal at the nonprofit RMI, who leads oil and gas sector work for Climate Trace. The team had previously found that oil and gas emissions, which are often self-reported by polluters, were undercounted, but the newest data shows that the situation is even worse than they realized. In the countries that are required to report oil and gas emissions to the United Nations Framework Convention on Climate Change, actual emissions are three times higher that the reported numbers.
Investors who want to reduce emissions in their portfolio can use the database to estimate the carbon footprint of facilities they might invest in, says McCormick. Policymakers can use it to find the biggest sources of emissions in their area, and therefore the places to target first as they try to hit emissions reductions goals. Anyone can use it to find the biggest polluters in their own neighborhood and hold them accountable.
Companies can also evaluate potential suppliers using the data. “For example, the carbon footprint per ton of steel of essentially every steel mill worldwide,” McCormick says. “Or the carbon footprint per nautical mile traveled of essentially every major container ship worldwide. Given that we can see from space that many of the cleanest facilities worldwide are not yet operating at 100% capacity, this does not have to come with a rebound effect, and is one of the most amazingly quick and easy ways to drive decarbonization I have yet come across.”
The tool is helping usher “in an era of radical transparency for emissions tracking,” UN Secretary-General António Guterres said today at the global climate talks. “You are making it more difficult to greenwash or, to be more clear, to cheat.”


