- | 9:00 am
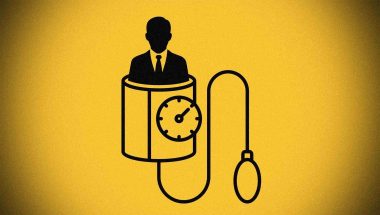
Could the technology behind Netflix’s recommendation engine help fight climate change?
Graph databases have long been used to provide customized content. But they could also be harnessed to help companies lower emissions.


Countless times every day, Amazon makes a product recommendation to a customer, LinkedIn suggests a new connection, Facebook and Instagram present customized content to users, and Netflix proposes a show the subscriber might like.
They all have something in common: Behind the scenes, graph database technology is being used to reveal relationships amid enormous amounts of diverse data and identify patterns in customer-purchase history, associations, and interests.
Beyond those companies, purpose-built graph databases are helping retailers gain a 360-degree view of shoppers, aiding financial services firms in identifying fraud, and giving health insurers a unified view of members’ medical interactions. And now, graph databases are starting to serve as a potentially potent tool in tackling a more profound problem: climate change.
To understand why, you first have to grasp some key nuances about the sources of the greenhouse gas emissions that are responsible for global warming and the actions needed to better control them.
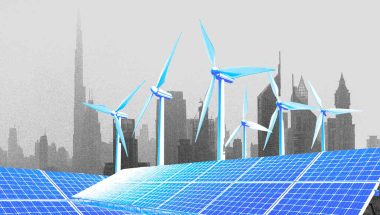
Companies are increasingly under pressure to reduce their CO2 and help keep the planet from warming to untenable levels. But many of these companies have faced a gaping hole in their ability to do so.
Here’s the problem: A company can control its own direct emissions and also control the types of energy it buys, but there’s a huge third source—emissions not associated with the company itself but with other parties like supply chain partners and customers who may be using its products in environmentally unsound ways.
This is known as the Scope 3 emissions issue—carbon emissions resulting from the activities of entities not directly owned or controlled by the company.
“Scope 3 is often where the impact is,” says a Deloitte report published in July 2021, noting that they can account for more than 70% of a company’s carbon footprint. There is increasing awareness that organizations need to reach deeper into their value chain and assess how Scope 3 is affecting their broader greenhouse gas approach.
The U.S. Securities and Exchange Commission (SEC) has proposed new rules for public companies that include a requirement to disclose emissions they are indirectly responsible for from their supply chains and products. A similar move is underway in the European Union.
A major hurdle, however, is poor data quality. Companies usually struggle to identify their Scope 3 emissions. They often aren’t sure what they should be measuring or how to measure it. Without that, it’s impossible to map what’s really happening and where, and take the steps necessary for improvement.
Here is where graph databases come in. Because graph databases are so powerful at building a connected view of disparate data, they are well suited to track environmental data across large value chains and provide real-time information about greenhouse gas effects. (My company, TigerGraph, provides a graph database solution for clients to gain real world value out of their data.)
For example, using a wealth of environmental, social, and governance (ESG) reporting data, government statistics, and proprietary information, a company can connect a variety of dots about resource use and emissions among its suppliers and customers.
While this information is readily available, going about collecting and integrating the data is often expensive and complex. The easier route? Empowering supply chains to actually share what they’re doing in the Scope 3 domain to map out what’s happening and where.
While easier said than done, using a graph database can help businesses to connect real-time, granular data shared by factory operators throughout the supply chain to identify bottlenecks and root causes of Scope 3 emissions. Graph technology works by connecting different sources of data to reveal real-world connections, relationships, and patterns to unlock greater value and help inform decisions. This data can include the number, type, and source of resource inputs, as well as the manufacturing and distribution processes, all of which when combined, map back to the success of sustainability commitments.
Using graph databases to delve deeper into Scope 3 relationships isn’t essentially different from how LinkedIn uses the technology to uncover deeper connections among users.
“Why does LinkedIn need a graph database?” the company asked in a 2020 post. Because much of the platform’s value for average members lies in “their second-degree network. These are the connections of your connections, such as the colleague of an old school friend, or the new boss of a coworker from a prior job.”
Similar to LinkedIn’s second-degree connections, power companies can improve reliability and efficiency by managing and monitoring energy usage using graph database technology. Graph technology explores, discovers, and predicts complex relationships within massive amounts of data, uncovering key insights such as spikes in demand or drops in energy supply.
Some interesting work is bubbling up to apply the technology that has worked so well for LinkedIn, Amazon, and others to combat climate change.
For example, the KnowWhereGraph project at the University of California, Santa Barbara, is relying on the technology to pilot an open knowledge graph to connect data from several massive and rapidly changing datasets that, when aligned, will produce critical insights to inform environmental policy, food security, soil health, and humanitarian aid.
The increased attention to the Scope 3 issue gives some hope that the world’s strategies for combating climate change are growing more concerted and sophisticated. Climate change obviously demands an all-out response from the public and private sectors—much of it complex to execute—but bringing in graph databases is a good example of a technology right under our noses that can help.

Featured Videos
Today's Top Stories:
More Top Stories:


FROM OUR PARTNERS